Work

Problems I’ve helped solve.

A selected record of data products, digital systems, and the decisions behind them.

Selected work

Three working products that turn public data, specialized knowledge, and everyday operational needs into useful tools.

Community health · Interactive research

Community Health & Workforce Lab

Explore where health needs may exceed workforce capacity across 207 Monroe County census tracts.

  • CDC PLACES
  • Spatial analysis
  • Scenario modeling
Explore the report
GETRACETWINRace → local
YOUR GOAL RACE.
YOUR LOCAL ROADS.
Goal courseLocal training
Everyday runTerrain workoutLong runRace simulation
Illustrative terrain comparison · Not a measured route

Endurance sport · Live product

GetRaceTwin

Race-specific local routes for everyday runs, terrain workouts, and race simulations, with training plans and run history.

  • Terrain matching
  • Training plans
  • Run history
Open GetRaceTwin
BookStoreBaseStore operations
More than what’s on the shelf.From the next sale to the next stocktake.
InventoryFind, scan & organize
Sales & buybacksKeep books moving
Customers & ordersKeep requests together
ReportingSee your store’s activity
Gift cardsStocktakePrint labels
Product overview illustration · No live store data

Retail operations · Live product

BookstoreBase

Manage inventory, sales, buybacks, customer requests, and special orders, with tools for stocktaking and store reporting.
  • Inventory & sales
  • Buybacks
  • Store operations
Open BookstoreBase
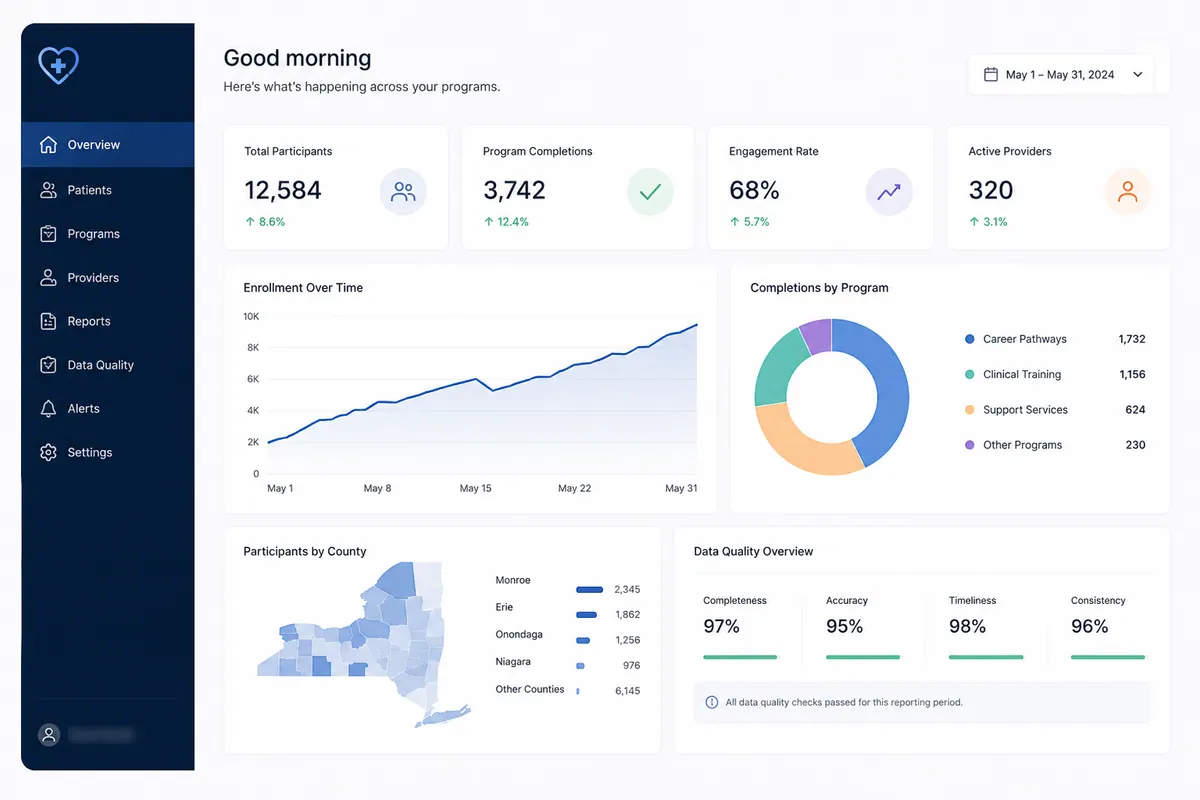
Program, service, and outcome information moving through validation into a trusted report

Case 01 · Statewide healthcare workforce program

Microsoft FabricAzurePower BIDAXPower QuerySQLSemantic modeling

Healthcare reporting

Building healthcare reporting systems people can trust

Building the reporting and analytics foundation for a statewide healthcare workforce initiative, reducing reporting effort by 60% and creating more dependable decision support.
Context
A $117M healthcare workforce initiative needed consistent program, participant, service, and outcome reporting across multiple stakeholders and operating teams.
Challenge
Fragmented definitions, manual handoffs, and inconsistent validation made every reporting cycle harder to complete and explain.
Constraints
The system had to improve reliability without disrupting familiar workflows or hiding the human review required for sensitive information.
My contribution
I defined KPI standards, created reusable semantic models, connected validation and automation into the reporting flow, and translated stakeholder needs into scalable platform capabilities.
System
A repeatable data pipeline and reporting system built around shared definitions, semantic models, validation, exception review, and self-service Power BI experiences.
Outcome
The system reduced reporting effort by 60%, generated more than $75,000 in annual operational savings, and supported analysis that improved participant enrollment outcomes by 80%.
Lesson
A reporting system succeeds when people can trust both the information and the process behind it.
Read the full case study
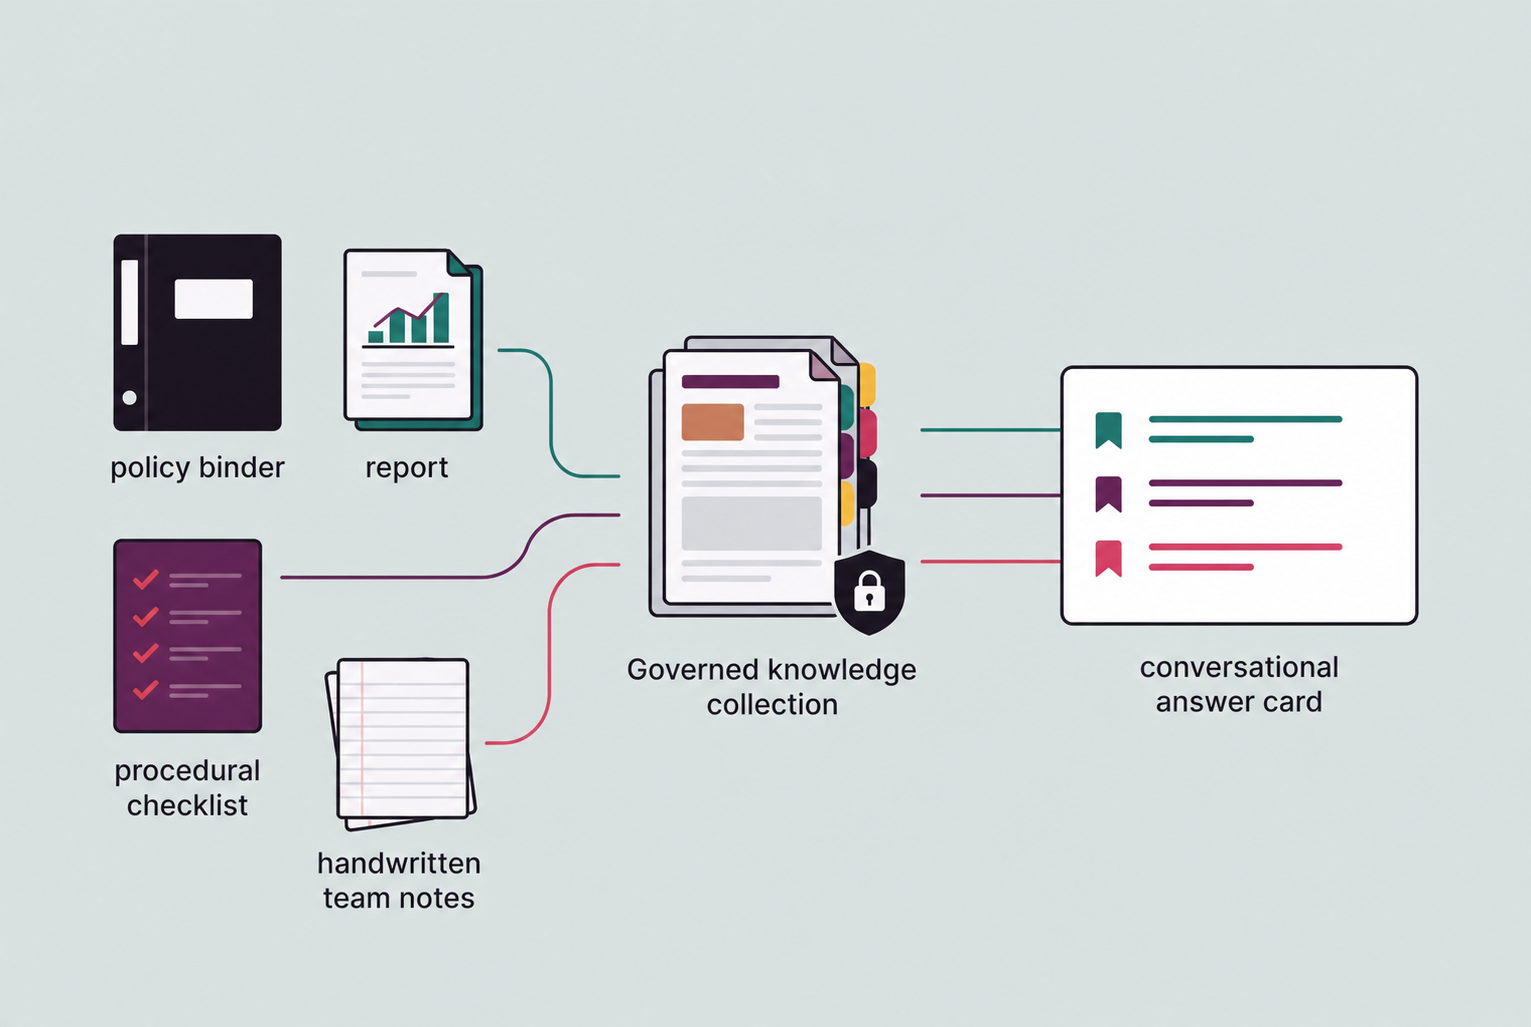
Organizational knowledge sources connected into one governed knowledge system

Case 02 · Cross-functional organizational teams

Retrieval-augmented generationLarge language modelsKnowledge architectureSearch

Knowledge systems and AI

Making organizational knowledge easier to find and use

Centralizing knowledge across teams into a governed foundation for a GPT-style assistant powered by retrieval-augmented generation.
Context
Useful knowledge lived across documents, team spaces, policies, reports, and the experience of individual staff members.
Challenge
People could not consistently find the most relevant or current answer, and a conversational interface would only amplify those weaknesses without a trustworthy knowledge foundation.
Constraints
The design needed clear source boundaries, permissions, update ownership, citations, and a way for people to recognize uncertainty.
My contribution
I framed the work as a knowledge-system problem first and an AI-interface problem second, connecting source organization, governance, retrieval, and conversational access.
System
A centralized knowledge layer connected to a GPT-style interface through retrieval-augmented generation (RAG).
Outcome
The concept gave people a clearer path from a natural-language question to relevant, contextual organizational knowledge while preserving traceability.
Lesson
Useful organizational AI begins with organized knowledge, explicit boundaries, and answers people can verify.
Read the full case study
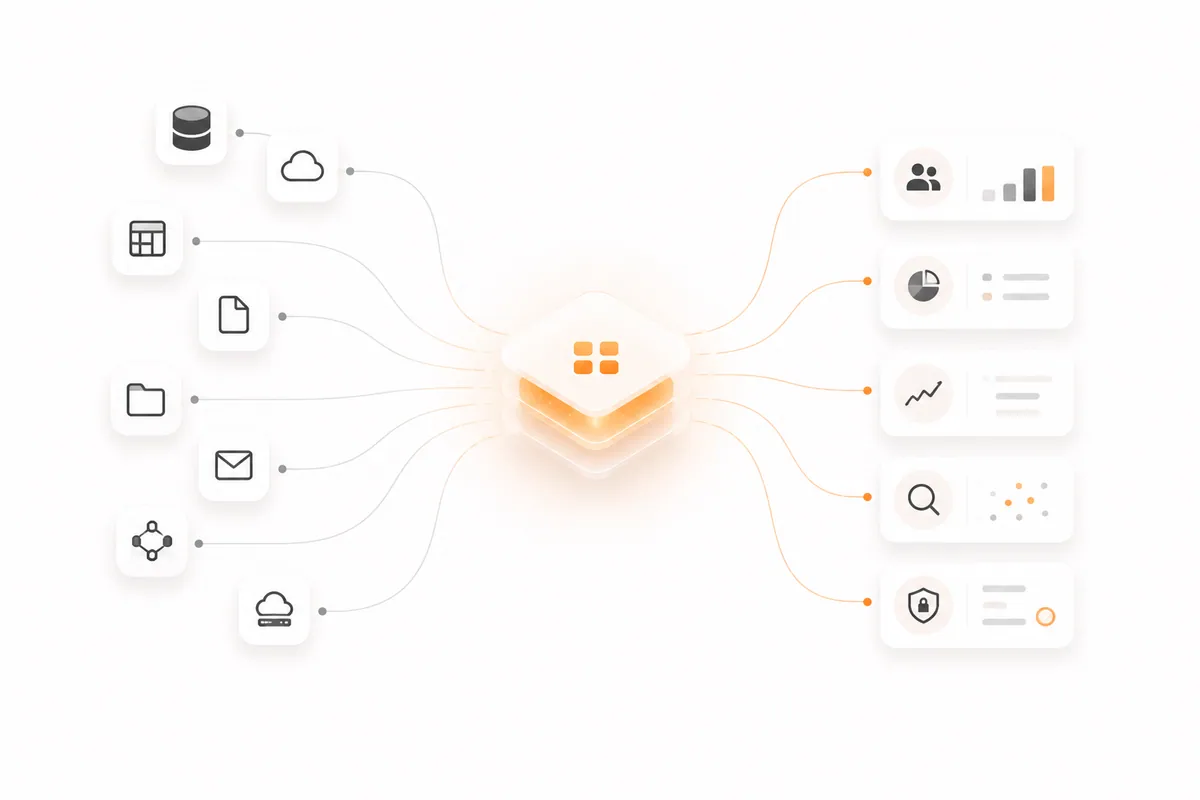
Grant and survey workflows organized into clear internal data products

Case 03 · Program and operational teams

Product discoveryData modelingWorkflow designMicrosoft 365

Internal products

Turning internal workflows into usable data products

Designing grant-management, survey-management, and related tools around the decisions, handoffs, and people that make the work function.
Context
Grant and survey processes combined intake, review, follow-up, analysis, and reporting across several people and tools.
Challenge
Fragmented workflows created repetitive coordination and made it difficult to understand status, ownership, and the information needed for the next decision.
Constraints
Different workflows shared structural needs but still required language, rules, and review patterns that made sense to their users.
My contribution
I translated operational processes into product structures, organizing information around user needs, decision points, and accountable handoffs.
System
Internal data products for collecting, reviewing, managing, and using grant and survey information.
Outcome
Teams gained clearer workflows and more practical ways to understand progress, manage exceptions, and use operational information.
Lesson
Internal tools deserve the same product thinking, research, and attention to usability as customer-facing products.
Read the full case study
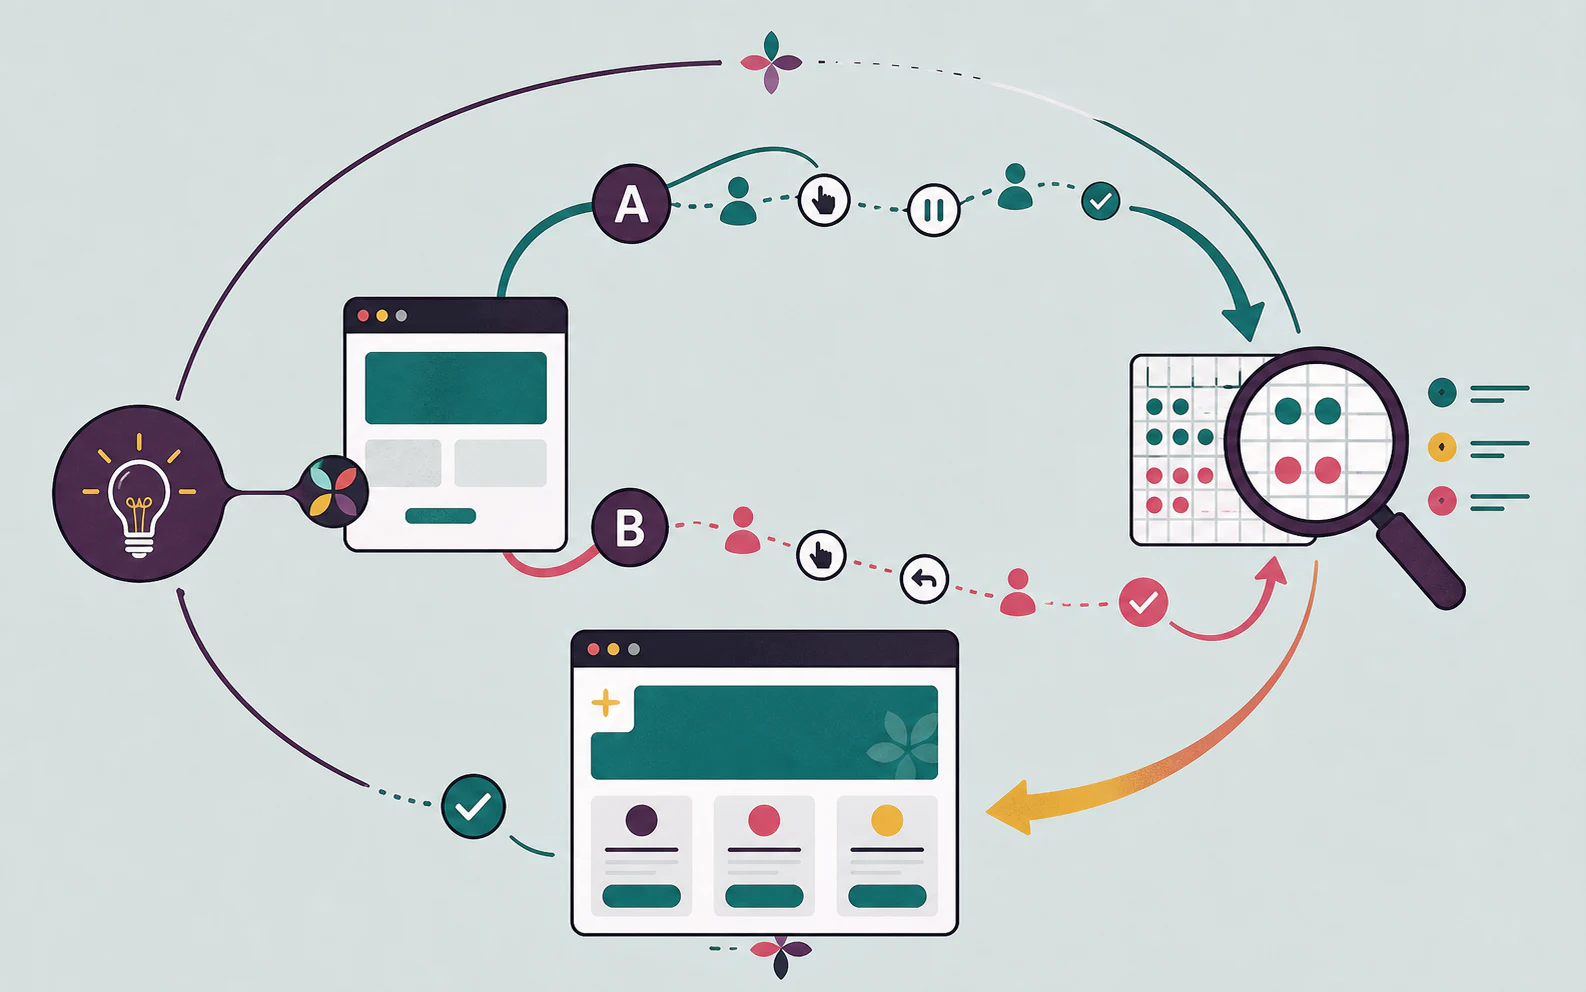
An iterative A/B testing loop connecting a product hypothesis, two variants, behavioral data, analysis, and the next product decision

Case 04 · Large-scale retail e-commerce

SQLPythonPower BIA/B testingCohort analysisFunnel analysis

Product analytics and experimentation

Using product analytics to improve a high-scale e-commerce experience

Combining KPI design, behavioral analysis, experimentation, and executive reporting to guide product decisions on an e-commerce platform generating more than $30M in monthly revenue.
Context
Product teams needed to understand how customers moved through a high-volume digital experience and which feature changes were improving engagement, conversion, retention, and revenue.
Challenge
Performance questions crossed multiple journeys, cohorts, and business measures. Teams needed evidence that could support prioritization without reducing customer behavior to a single dashboard metric.
Constraints
Analysis had to operate at commercial scale, remain useful to both product and business partners, and fit an iterative product-development rhythm.
My contribution
I defined success metrics, built Power BI reporting, used SQL and Python for exploratory analysis, and conducted A/B, cohort, and funnel analysis to evaluate feature hypotheses.
System
A product measurement practice connecting behavioral data, experiments, KPI frameworks, dashboards, and cross-functional decision-making.
Outcome
The analysis contributed to product improvements associated with a 40% increase in user engagement and helped improve delivery time by 5% to 12%.
Lesson
Product analytics is most useful when the measurement plan is part of the product decision, not a report produced after the decision has already been made.
Read the full case study
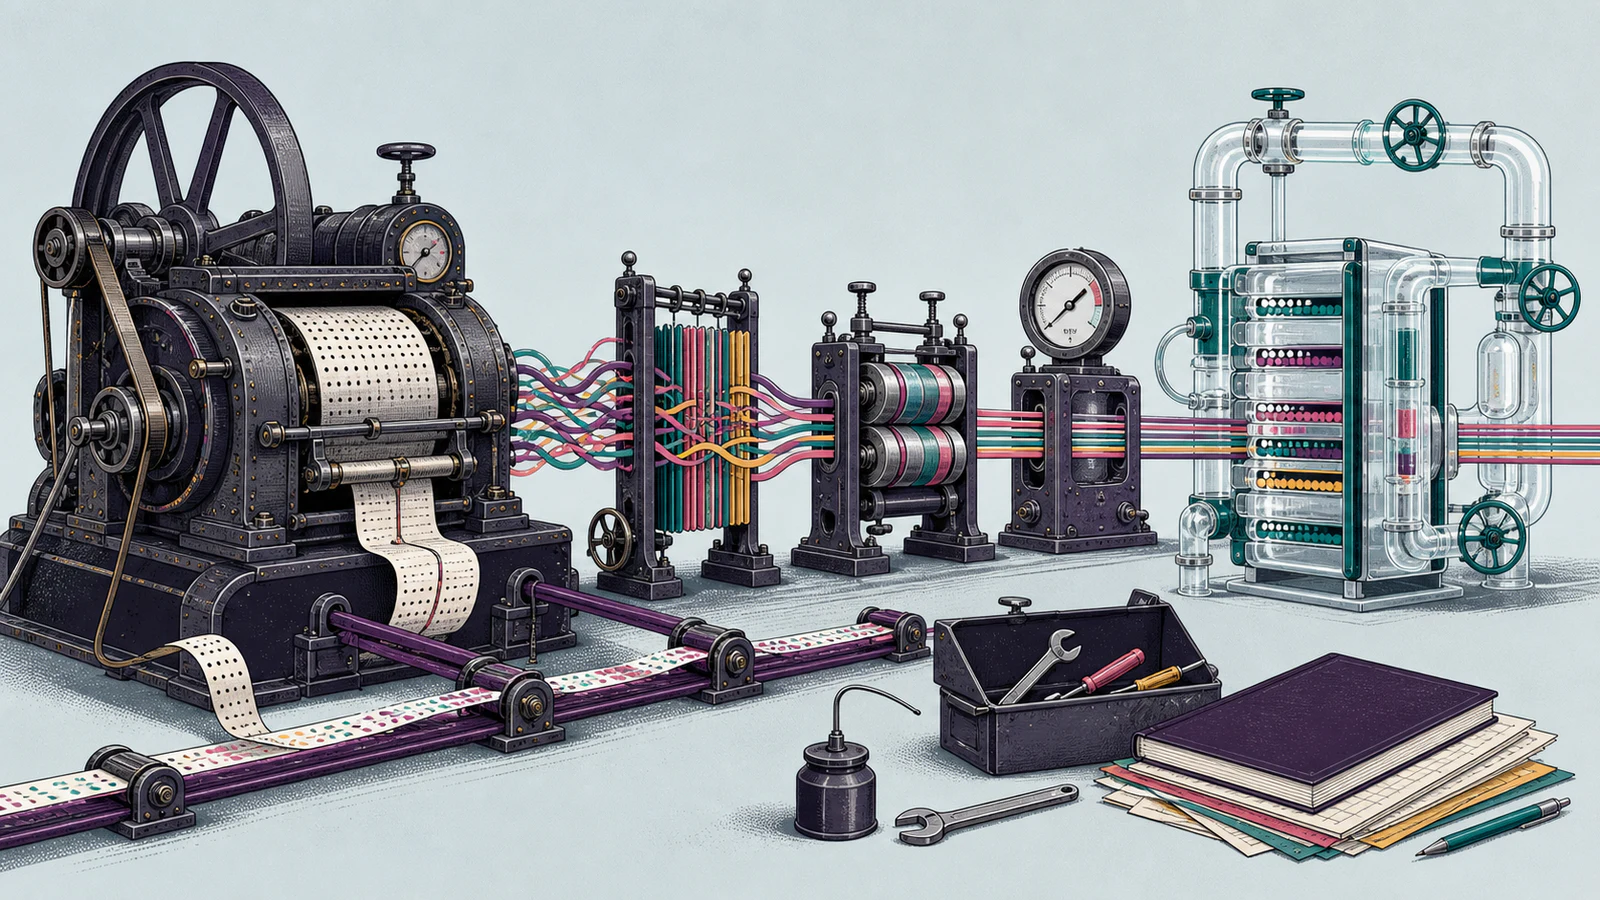
An industrial-age data machine modernized with transparent extraction, transformation, validation, and cloud reporting mechanisms

Case 05 · Life insurance analytics

IBM DB2SQLETLData warehousingIBM CloudRoot-cause analysis

Data architecture and modernization

Modernizing insurance analytics from legacy data to cloud reporting

Designing ETL and data-warehouse foundations that moved policy, rider, and claims data from a legacy DB2 environment toward automated cloud reporting.
Context
Policy, rider, eligibility, and claims analysis depended on large datasets in a legacy IBM DB2 environment while the organization was modernizing analytics and reporting.
Challenge
Teams needed to move and model data for reporting while maintaining production reliability and the ability to investigate pipeline and scheduled-job failures.
Constraints
The modernization had to work with established source systems, large datasets, insurance-domain rules, and ongoing production support responsibilities.
My contribution
I helped design the data-warehouse solution, developed ETL processes, wrote SQL for operational and exploratory analysis, and performed impact and root-cause analysis on data pipelines.
System
A data-warehouse and ETL foundation connecting IBM DB2 insurance data to cloud-based analytics and automated reporting.
Outcome
The modernization created a clearer path from legacy operational data to repeatable analysis and reporting while strengthening diagnosis and support for production data flows.
Lesson
A modern analytics platform is not only a destination architecture. It also needs traceable transformations and an operating model for the day something fails.
Read the full case study
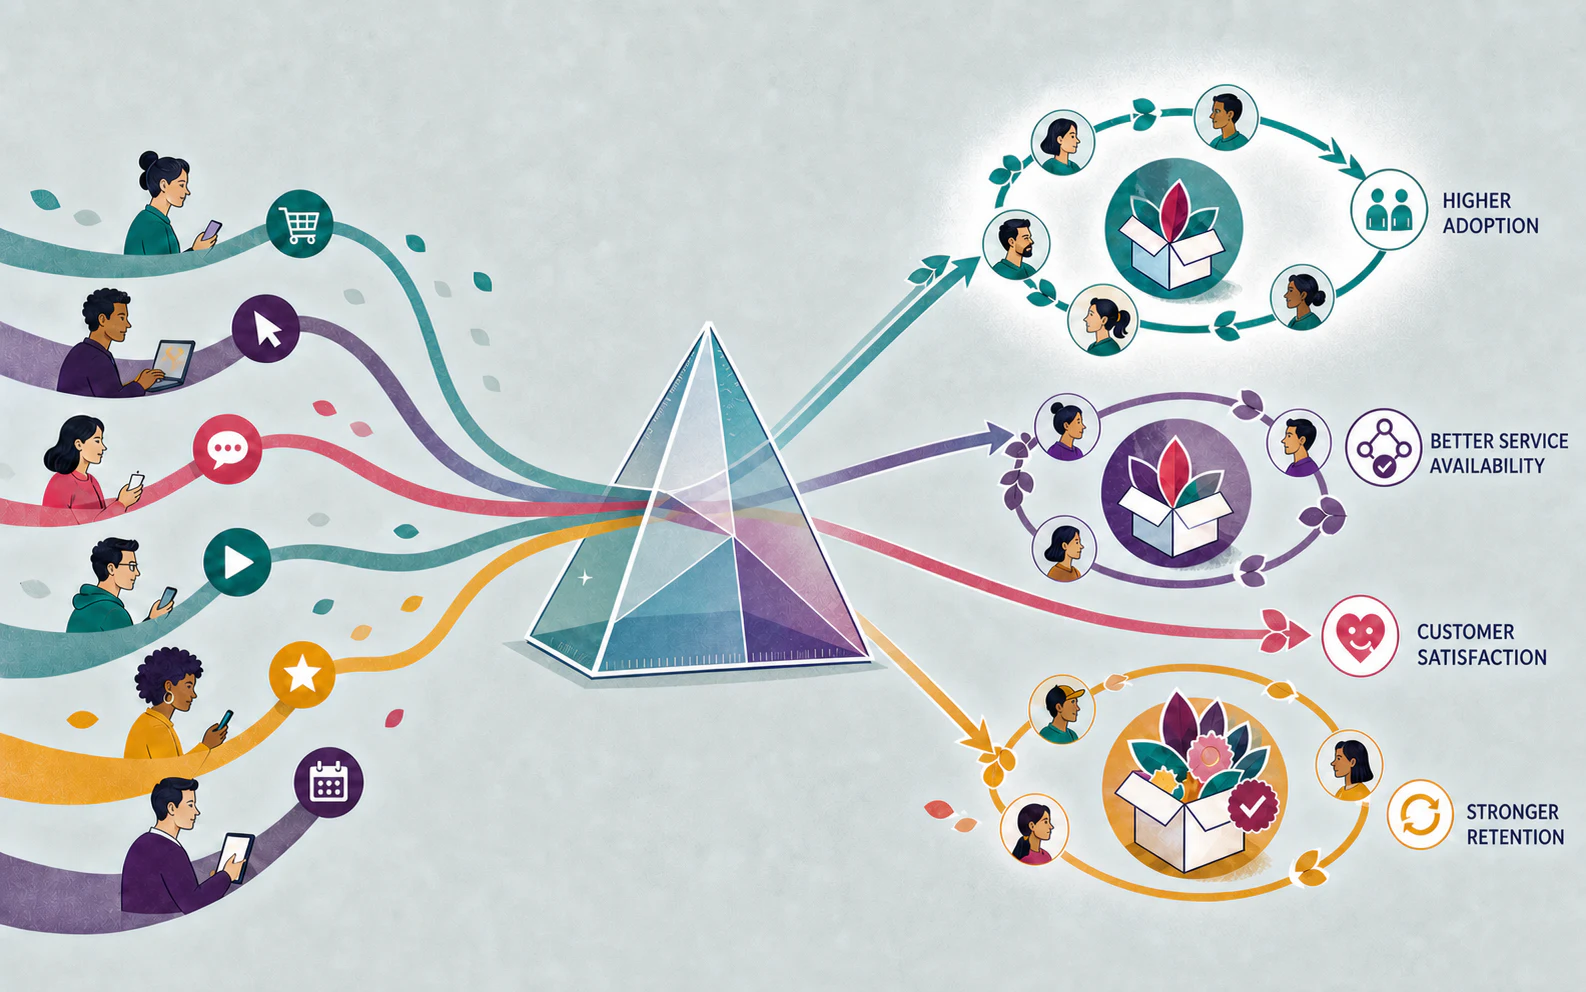
Customer behavior and service signals passing through a strategy prism into higher adoption, service availability, satisfaction, and retention

Case 06 · Subscription software platform

SQLExcelCustomer segmentationKPI designPricing analysis

Customer and growth analytics

Turning customer behavior into a clearer subscription strategy

Using KPI design, customer segmentation, and a cost-delivery matrix to refine subscription positioning and increase entry-level plan adoption by 35%.

Context
An early-stage real-estate technology platform needed a clearer way to connect customer needs, delivery cost, and the structure of its subscription offers.
Challenge
The team needed to understand which customers the entry-level plan served, what it should include, and how pricing choices affected adoption and sustainable delivery.
Constraints
The analysis had to work with a smaller product environment and practical tools while still producing a decision the team could act on.
My contribution
I defined product KPIs, analyzed customer segments and behavior, and helped design a cost-delivery matrix for the subscription model.
System
A lightweight growth-analytics approach combining KPI tracking, customer segmentation, and subscription cost-delivery analysis.
Outcome
The refined entry-level subscription offer increased adoption by 35%.
Lesson
Even a simple product decision improves when customer behavior, value, and operational cost are examined together.
Read the full case study

Have a complicated question?

Let’s make it easier to understand.

Start a conversation